Monitoring (Available since v1.3.0)
Starting with Wiredoor v1.3.0, native monitoring for NGINX and WireGuard is available via Prometheus and Grafana.
This enables real-time visibility into HTTP and VPN traffic across your Wiredoor deployment, with zero external dependencies.
Getting Started
Whether you’re setting up Wiredoor for the first time or already have it installed, you can enable monitoring using the wiredoor/docker-setup repository. New users can clone the repository to get started, while existing users should update the repo and recreate the relevant containers to enable monitoring.
1. Clone or update docker-setup
# For new installations
git clone https://github.com/wiredoor/docker-setup.git wiredoor
cd wiredoor
docker compose up -d

# For existing installations
cd /path/to/wiredoor-docker-setup
git pull
docker compose pull
docker compose up -d --force-recreate
2. Required containers
Make sure the following containers are updated and running:
wiredoorprometheusgrafana
Once restarted, Prometheus will automatically begin scraping metrics from Wiredoor.
Accessing Grafana
By default, Grafana is only available on the local network (port 3000 on the container). If you want to access it from the internet securely,
you can expose it using the special Wiredoor_Local node.
Using Wiredoor_Local node to expose grafana
Grafana is running on the same docker network as Wiredoor server. This allows Wiredoor to expose Grafana without requiring its port to be mapped to the host.
In this case, you can use http://grafana:3000 as the target address when exposing the service via Wiredoor_Local node:
- Open the Wiredoor Dashboard (e.g.
https://wiredoor.yourdomain.com) - Go to the Wiredoor_Local node
- Add a new HTTP Service
- Configure the service with the following details:
- Service Name:
My-Grafana-Service - Public Domain:
grafana.yourdomain.com(make sure this domain points to the public IP of your Wiredoor server) - Hostname/IP:
grafana - Backend Port:
3000
- Click Save
Once saved, Grafana will be accessible at: https://grafana.yourdomain.com
Available dashboards
Wiredoor provides two official dashboards designed for use with Grafana. These dashboards give you visibility into your HTTP traffic and WireGuard peer activity in real time.
These dashboards are automatically imported when using the wiredoor/docker-setup repository.
All official dashboards are also tagged with
Wiredoor.
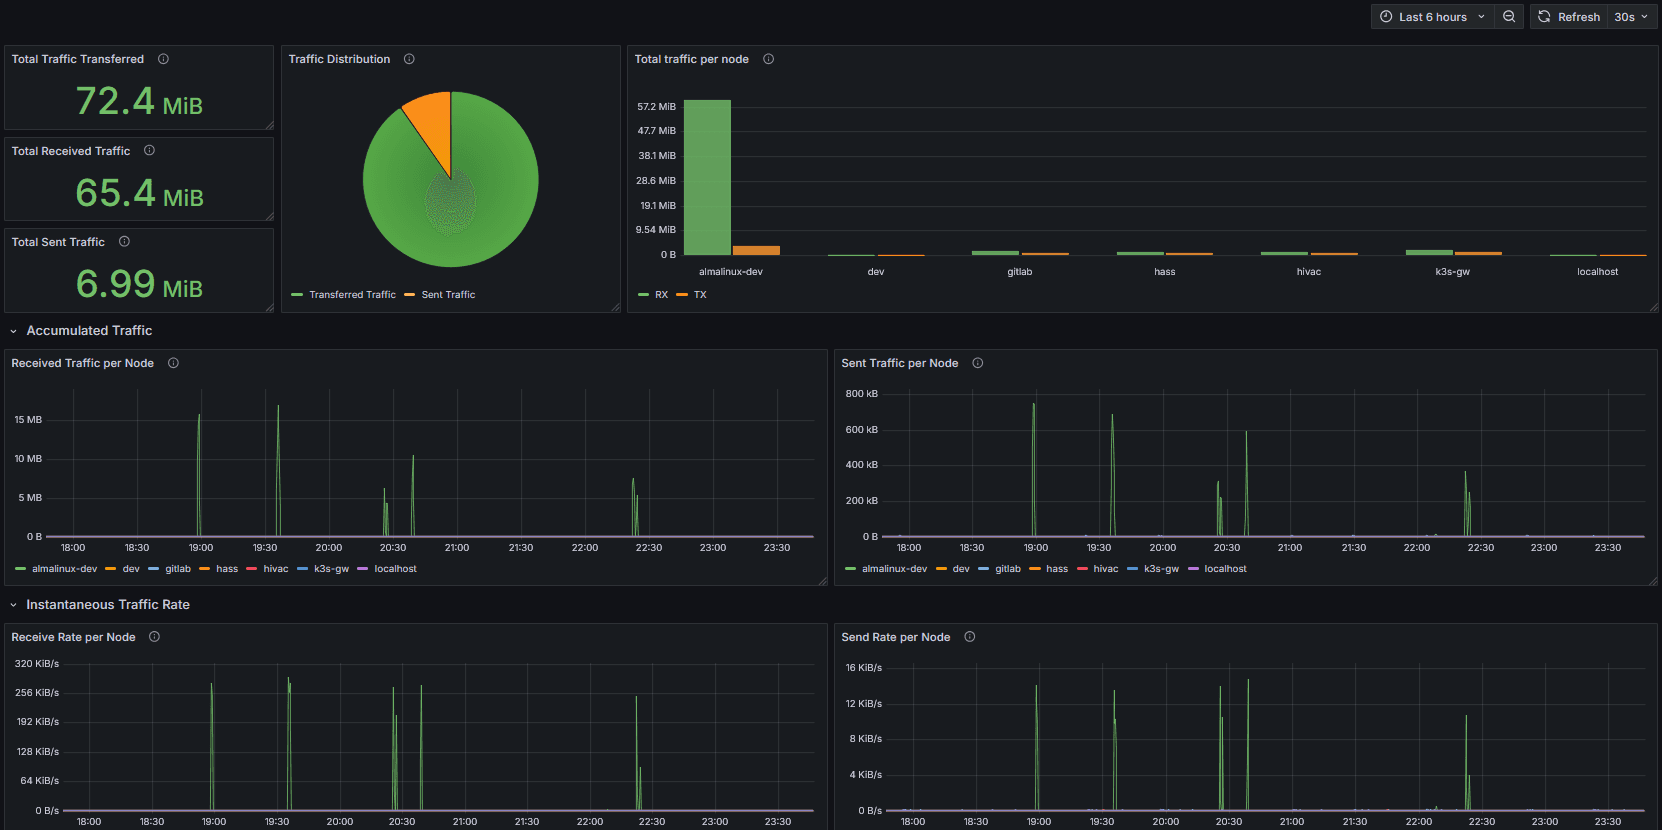
Wiredoor: WireGuard Monitoring
This dashboard helps you monitor your VPN traffic and node connectivity:
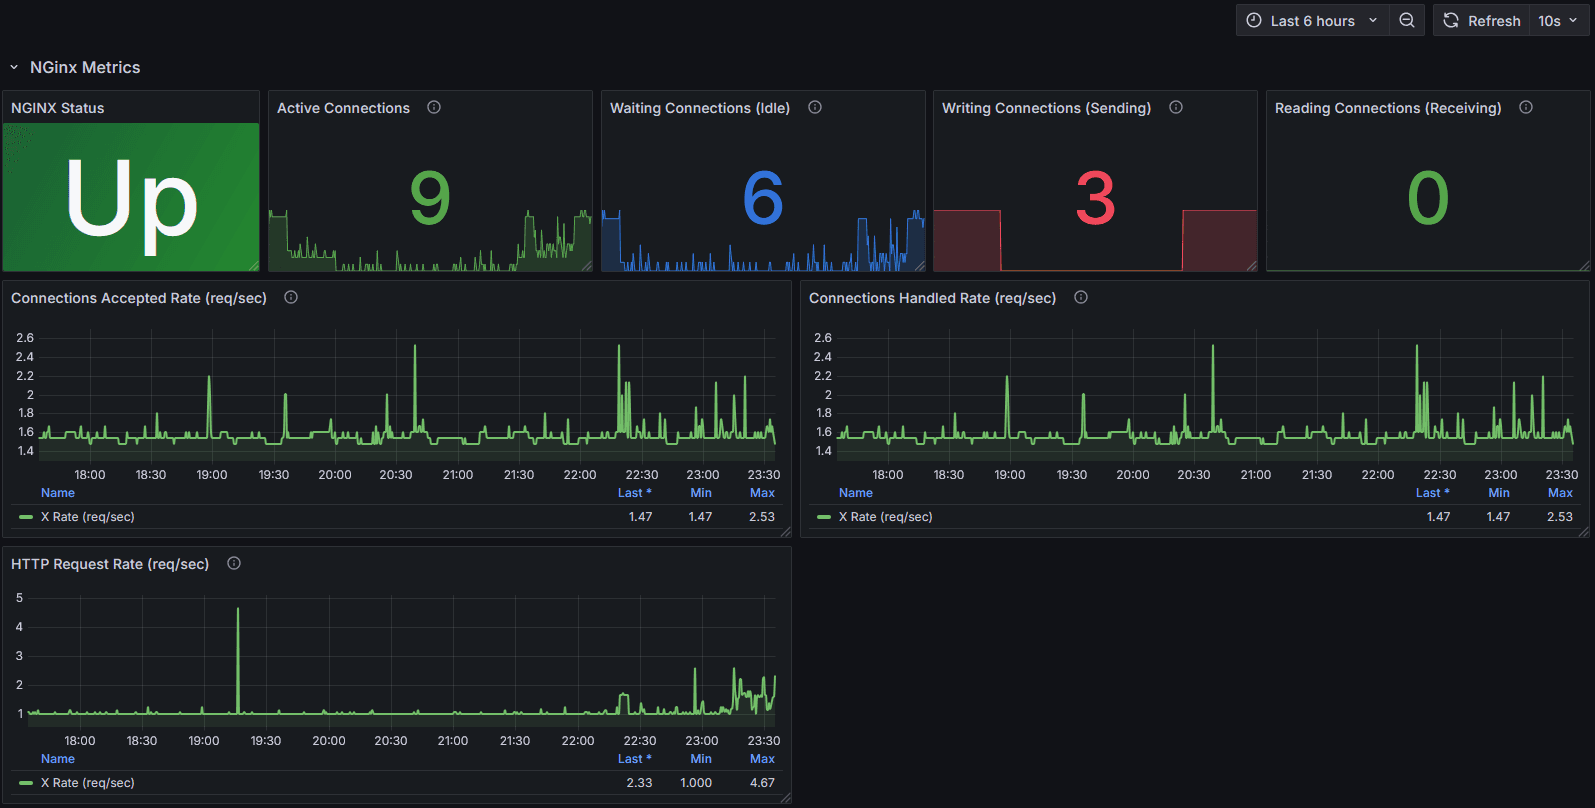
Wiredoor: Nginx Monitoring
This dashboard provides visibility into your public HTTP traffic:
Depending on your setup, you may configure other dashboards available in Grafana (e.g., for CrowdSec, Node Exporter, etc.).
Only dashboards tagged with Wiredoor are officially maintained by the Wiredoor project.
Where to find the JSON definitions
If needed, you can find the JSON definitions of these dashboards in the repository:
extras/grafana/provisioning/wiredoor
├── nginx.json
└── wiredoor.json
You can import them manually into any Grafana instance.